
Math brings out the artist in you!
While the industrious student can simply whip out a graph calculator to draw up graphing functions, figuring out functions the old-fashioned way can be pretty keen. With nothing but a pencil and a piece of paper divided into little squares, we can create lines and make ‘em dance to the curve of a slope intercept form. Oh yeah, remember that you can hire an online math tutor from Studygate!
We all knew math was a cute little number, but here is where we prove it!
Let’s take a simple equation:
y = mx + b
This is a pretty basic format for graphing. We have a Y axis that has a direct relationship with the X axis. The ratio between Y and X is determined by M.
Let’s throw in some numbers and see where they land:
y = 2x + 6
This is as easy as it gets. Let’s whip up a graph:
Let’s start easy, with x = 0.
So we know that when X is at 0, Y is 6. The “2” is the ratio between X and Y. If X was 1, then simply multiply X x 2 + 6 = 8.
We can create a quick chart between X and Y. Don’t forget that we can go into negative values for X and Y s as well!
| X | Y |
| -4 | -2 |
| -3 | 0 |
| -2 | 2 |
| -1 | 4 |
| 0 | 6 |
| 1 | 8 |
| 2 | 10 |
| 3 | 12 |
| 4 | 14 |
| 5 | 16 |
| 6 | 18 |
| 7 | 20 |
Then, plot the points and connect to form a line!
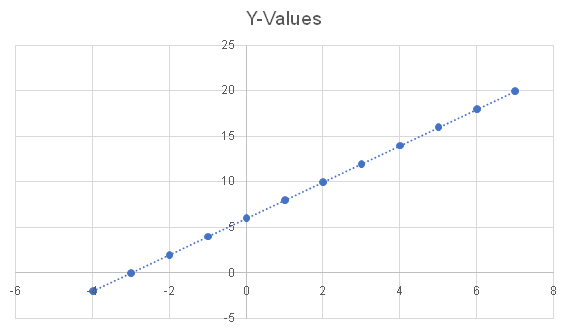
Pretty neat, huh?
****QUICK TIP: go back to the equation
We can break M down to represent the change over Y over the change over X. If it were a fraction, it would look like this: change over Y ÷ change over X
Since 2 is basically 2÷1, we can simply say that for every change in X, we move Y up 2 spaces! Look at the chart and do the math. See how it works?
What is M was a fraction?It still works out:
This means that for every X value we have, Y goes up by . The chart would look like:
| X | Y |
| -4 | -1 |
| -3 | -.25 |
| -2 | .5 |
| -1 | 1.25 |
| 0 | 2 |
| 1 | 2.75 |
| 2 | 3.5 |
| 3 | 4.25 |
| 4 | 5 |
| 5 | 5.75 |
| 6 | 6.5 |
| 7 | 7.25 |
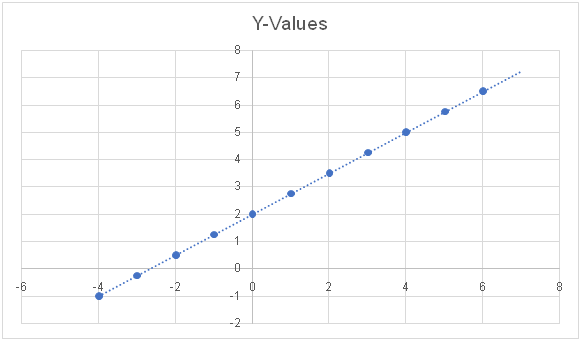 Graphs with fraction M look less steep than graphs where M is a whole number.
But where does this get us with graphing functions?
It’s really easy: it’s basically the same thing!
ƒ(x) = x2 + 2
In this case, Y = F(x). Since the equation is squared, there will be some curves as the Y intercept changes from positive to negative. But the procedure is the same.
So let’s throw some X values in and see what we get! You can also contact an online math tutor to complete this step.
| X | Y |
| -5 | 23 |
| -4 | 18 |
| -3 | 11 |
| -2 | 6 |
| -1 | 3 |
| 0 | 2 |
| 1 | 3 |
| 2 | 6 |
| 3 | 11 |
| 4 | 18 |
| 5 | 23 |
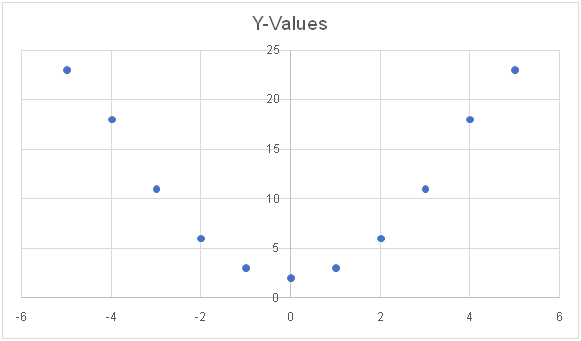
As you can see, we have a curve!
Imagine the possibilities: with numbers, you can draw anything!
For more math tips our guide to solving the quadratic formula will help.